DECISION INTELLIGENCE FOR THE LEAD AND COPPER RULE ERA
Stop guessing. Start solving.
Service ID helps utilities empower homeowners to complete their LSL inventories using customer photos and machine learning — then maps every replacement to a funding source. Decision intelligence, purpose-built for LCRI.
TRUSTED BY UTILITIES
RECOGNIZED BY
THE PLATFORM
One platform. Four layers of intelligence.
From verified data to funded replacements to institutional memory — Service ID is the system of record for the LCRI era.
Verified Inventory
The data layer
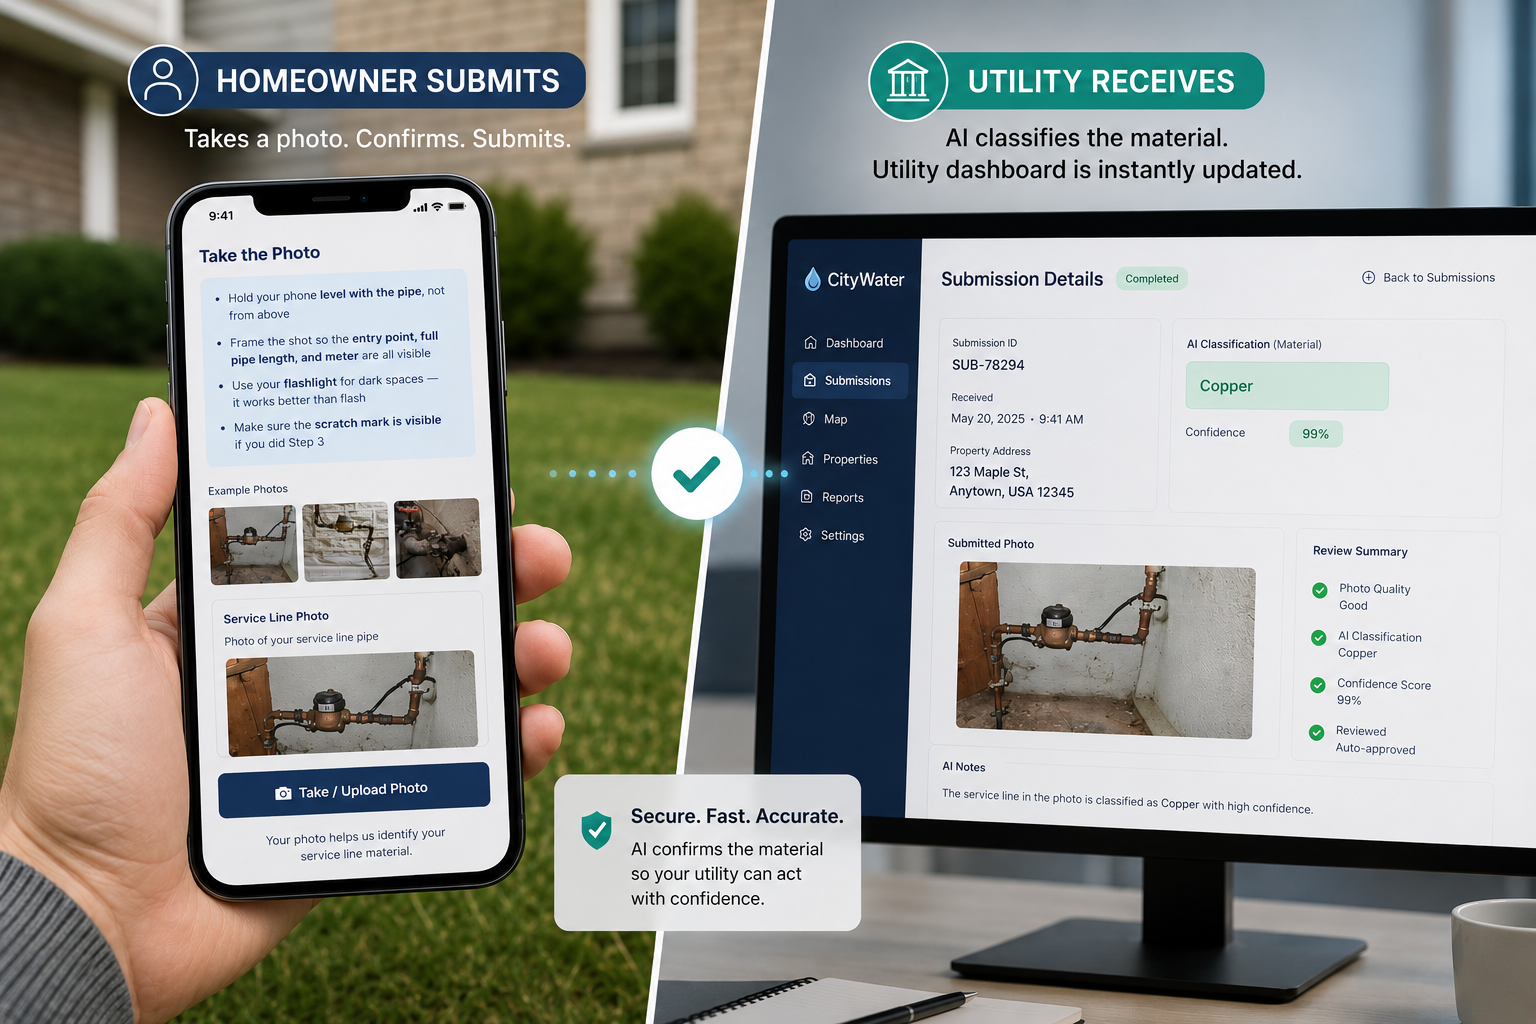
Photo-verified service line classifications with 95%+ machine-learning accuracy. One-click corrections, no data entry. Defensible under LCRI baseline scrutiny — not probabilistic guesses.
Funding Intelligence
The capital layer
Every replacement mapped to a funding source. Principal forgiveness optimization, DAC scoring, and grant pipeline navigation built in.
Replacement Planning
The execution layer
Multi-year, phased replacement plans matched to verified data and funding strategy. Sequence the right work in the right order — and execute with confidence.
Utility Intelligence
The platform layer
Hydrants, meters, mains, council decisions, field notes — every asset and every memory, captured and searchable. The platform that compounds in value the longer you use it.
What's your LCRI exposure, before Nov 1, 2027?
Run the math on your inventory — required replacement exposure and avoided verification costs. The numbers below are directional. Yours can be specific.
LCRI BASELINE STARTING LINE
00
DAYS
00
HOURS
00
MINUTES
00
SECONDS
WHAT WE FOUND FOR ONE WISCONSIN UTILITY
A 21,000-connection utility had $13.5M in funding gap reduction waiting to be captured.
Below is an anonymized sample of what Service ID surfaced through verification and bundled application strategy. Real numbers. Identifying details adjusted to prevent attribution.
01 · VERIFICATION SCENARIO COMPARISON
Three paths through LCRI. Three different funding gaps.
Same utility. Same lead lines requiring replacement. Different strategies for getting there — and very different out-of-pocket costs.
SCENARIO 01
Do Nothing
Unknowns count as lead under LCRI
TOTAL PROJECT
$62.5M
BEST PF
$32.5M
FUNDING GAP
$30.0M
WORST CASE
SCENARIO 01
Do Nothing
WORST CASE
Unknowns count as lead under LCRI
PROJECT
$62.5M
BEST PF
$32.5M
GAP
$30.0M
SCENARIO 02
Verify Only
Service ID resolves unknowns; standard application
TOTAL PROJECT
$39.9M
BEST PF
$21.7M
FUNDING GAP
$18.2M
BETTER
SCENARIO 02
Verify Only
BETTER
Service ID resolves unknowns; standard application
PROJECT
$39.9M
BEST PF
$21.7M
GAP
$18.2M
SCENARIO 03
Verify + Bundled Strategy
Service ID's full optimization — 100% + 75% tracts bundled at 100% PF; remainder blended
TOTAL PROJECT
$39.9M
BEST PF
$23.5M
FUNDING GAP
$16.5M
OPTIMAL
SCENARIO 03
Verify + Bundled Strategy
OPTIMAL
Service ID's full optimization — 100% + 75% tracts bundled at 100% PF; remainder blended
PROJECT
$39.9M
BEST PF
$23.5M
GAP
$16.5M
THE SERVICE ID DELTA
$13.5M
Total funding gap reduction from Scenario 01 to Scenario 03. Verification removes confirmed copper lines from the replacement pool, and bundled application strategy captures principal forgiveness most utilities don't know they qualify for.
02 · TRACT-LEVEL SCORING
Every neighborhood scored individually.
DNR's principal forgiveness logic varies dramatically by census tract demographics. Most utilities don't realize how much variance is hidden in their service area.
21
TRACTS SCORED
~21,000
TOTAL SERVICE LINES
~29%
CLASSIFIED AS LEAD
The variance shown above is what makes bundled application strategy work — 100% PF tracts and 75% PF tracts blend together into a single high-priority application that captures full principal forgiveness for both, which neither could achieve alone.
03 · TOP RECOMMENDATIONS
Specific tracts ranked by PF competitiveness.
The highest-scoring tracts in this analysis. Each row shows the demographic drivers behind the score — these are the components DNR weighs in scoring disadvantaged community status.
01
Tract A
100% PF TIER
SCORING DRIVERS
MHI: $34K (45% of state)
Poverty rate: 65%
02
Tract B
100% PF TIER
SCORING DRIVERS
MHI: $47K (62% of state)
Poverty rate: 35%
03
Tract C
100% PF TIER
SCORING DRIVERS
MHI: $53K (70% of state)
Poverty rate: 32%
Each recommendation includes the demographic drivers explaining why the tract scores as it does. These four components — MHI as percent of state, poverty rate, county unemployment, and lowest-quintile income — are how DNR ranks tracts for principal forgiveness eligibility.
WANT TO TRY YOUR OWN NUMBERS?
Run the math on your inventory — operational drag, replacement pool exposure, and verification ROI.
The numbers above are real for one utility. Use the interactive calculator to model your service area: tunable assumptions, instant feedback, no email required.
Run Your Own Numbers →GET THE REAL ANALYSIS
Your numbers, your tracts, your funding gap. Within one business day.
We run the analysis on your specific service area — tract-by-tract demographic scoring, bundled application optimization, and the verification scenario comparison shown above. The same analysis you just saw, but for your utility. No automated output. Actual analysis from our team.
SOURCES & METHODOLOGY
LCRI verification standard: 40 CFR §141.84 (Lead and Copper Rule Improvements, finalized October 2024); EPA Inventory Guidance §2.1.4 on classification evidence requirements. Beginning November 1, 2027, required replacement applies to lead, GRR, and unknown lines at 10% per year.
Sample analysis source:The figures shown are from a real Service ID analysis of a 21,000-connection Wisconsin water utility. Tract identifiers have been renamed and headline figures lightly rounded to prevent attribution. The methodology, scoring logic, and demographic drivers reflect actual Wisconsin DNR Lead Service Line program scoring (Tables 2, 3, 5, 6 of DNR's Disadvantaged Community methodology — MHI as percent of state, 200% FPL poverty rate, county unemployment differential, and lowest-quintile income). The 21 tracts shown represent the full service area.
Scenario modeling:"Do Nothing" assumes all unknowns count as lead under LCRI's both-sides classification rule. "Verify Only" assumes Service ID verification resolves unknowns before LCRI baseline, reducing total project scope proportionally. "Verify + Bundled Strategy" applies Service ID's tract-targeted bundling optimization on top of verification — 100% PF and 75% PF tracts consolidated into a single high-priority application.
Principal forgiveness methodology: Wisconsin DNR scores census tracts on a 0–100+ scale using four demographic factors. Tracts scoring above thresholds qualify for 100%, 75%, 50%, or 25% principal forgiveness tiers. Bundled application strategy aggregates qualifying tracts to maximize overall PF capture.
CASE STUDY
Verona proved what a verified inventory looks like.
When the City of Verona partnered with Service ID for their LSL inventory pilot, the results redefined what utilities should expect from a verification platform. Homeowner participation rates dwarfed industry norms. Classification accuracy held above 95%. The full pilot completed in under 30 days — for less than a quarter of the projected cost.
Read the full case study →10–25×
INDUSTRY PARTICIPATION RATE
95%+
CLASSIFICATION ACCURACY
$125K+
IN PILOT SAVINGS
<30
DAYS TO COMPLETE PILOT
RECOGNITION
Backed by the institutions building the future of water.
Service ID has been recognized by the leading accelerators, competitions, and research programs in water technology.
GLOBAL COMPETITION
Water Council Global Tech Challenge
Runner-up among 50+ submissions from 23 countries — recognized as one of the most promising water-tech innovations globally.
STATE RECOGNITION
WI Governor's Business Plan Competition
2nd Place, Technology Category, 2025. Recognized by the State of Wisconsin as a leading early-stage technology company.
RESEARCH & VALIDATION
NSF I-Corps Graduate
Completed the National Science Foundation's I-Corps program, including 31 customer discovery interviews validating Service ID's product-market fit.
LCRI STARTS IN 2027
The utilities that get this right won't be the ones with the most data. They'll be the ones with the right intelligence.
See how Service ID helps leading utilities turn LCRI compliance into a competitive advantage.